I couldn’t debug TypeScript from my Angular 2 app files at first…
but then I got it working. Here’s how:
(Note: The environment used here was Windows 10 and a beginner Angular 2 app cloned from the Angular Quick Start repo from the Angular Github repo. If you’re on a Mac or Linux system, I can’t say whether the solution presented he will work for those environments.)
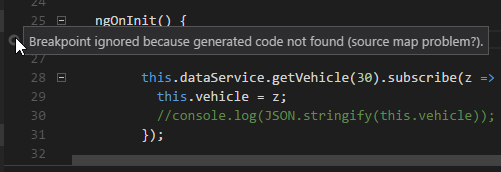
This post explains my trouble (and solution) of using the the Microsoft VS Code Debugger for Chrome extension to debug my first beginner Angular 2 app from within VS Code. I let VS Code create the default launch.json file that is required (details in this link: https://code.visualstudio.com/docs/editor/debugging) , but when I started the debugger from inside VS Code, and I put a breakpoint on a line of code in a TypeScript file (.ts), VS Code complained that it could not find the corresponding .js file (therefore it could debug from the .ts file), and it put a little gray circle beside the line of code, instead of the typical red dot, with a warning:
“Breakpoint ignored because generated code not found (source map problem).”
When searching the web about this issue, all of the suggested launch.json code examples from various posts I found all looked very similar in what they suggested was required to fix the issue, but I never could get any of them to work for my app / dev environment. But, I finally found one that did work for my beginner Angular 2 project, which I had begun by cloning the Angular 2 Quick Start repo.
I found the magic solution for me in one user’s example that he posted to an issue on the VSCode GitHub project: https://github.com/Microsoft/vscode-chrome-debug/issues/367 and again the issue of where the generated .js and .js.map files are located (in a Windows environment) is addressed in this issue: https://github.com/angular/angular-cli/issues/1223
Now it works!
Here’s the part from his included code that worked for me:
|
1 2 3 4 5 6 7 8 9 10 11 12 13 14 15 16 17 18 |
{ "version": "0.2.0", "configurations": [ { "name": "Launch Chrome against localhost, with sourcemaps", "type": "chrome", "request": "launch", "url": "http://localhost:3000", "sourceMaps": true, "trace": true, "webRoot": "${workspaceRoot}/src", "userDataDir": "${workspaceRoot}/.vscode/chrome", "sourceMapPathOverrides": { "webpack:///C:*":"C:/*" } } ] } |
IMPORTANT: Kill all current VS Code and Chome instances to start fresh.
After making this change to my launch.json, I made sure to kill all existing VS Code instances and all Chrome instances. Then I used npm start and then I started the debugger from inside VS Code. It then launched its own instance of Chrome to start my app, and finally, VS Code debugger was able to trace into the .ts code because it was finally able to find the generated .js code.
.gitignore changes
I also found that I needed to add two folders to my .gitignore file:
|
1 2 |
out .vscode/chrome |


Unfortunately , dont fix my problem.
Still get “Breakpoint ignored because generated code not found (source map problem?).”
Why you used : “webpack:///C:*”:”C:/*” ?
Tanks for the help any way 🙂